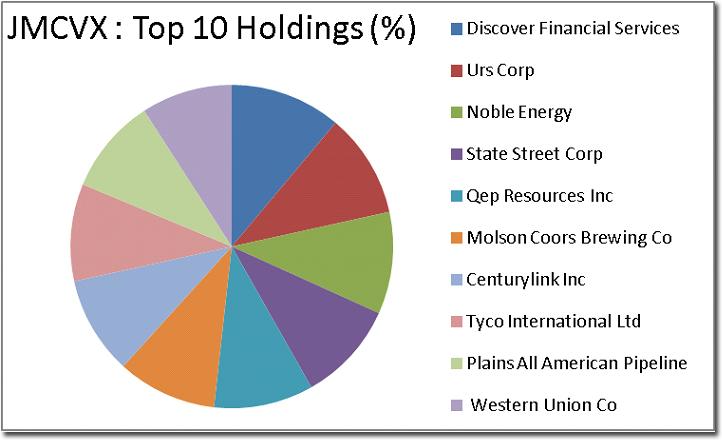
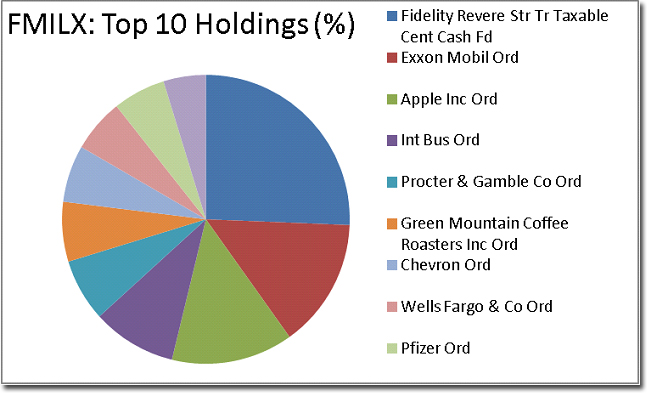
 Having looked at a number of different mutual funds that focus in on generating returns based on the performance of specific market aspects, I’ve decided to spend this week comparing a set of broad market funds. By including funds such as the Janus Investment Fund Mid-Cap Value Fund, and the Fidelity New Millennium Fund, we can begin to see how value investing can be implemented as a broad market strategy.
Both of these funds focus on generating capital gains from value-driven investment strategies, while still maintaining a focus on maintaining full diversification within the portfolio. Realistically, these funds can act as a fantastic back-bone to any personal portfolio.
Their combination of breadth and sophisticated evaluation can provide investors with a well calculated diversified exposure to the greater market, so that they can focus in on the aspects of investing that either interests them most, or for which they personally are most suited to personally handle.
If nothing else, these funds provide the peach of mind that your portfolio needs to keep you from stressing out over your finances. In this first article, I’ll provide a side-by-side overview of the funds, which can be used as a reference for the evaluative section that will be presented in the next posting.
Name: Janus Investment Fund: Perkins Mid Cap Value Fund; Class T Shares
Symbol: JMCVX
NAV: $21.71
Name: Fidelity MT Vernon Street Trust: Fidelity New Millennium Fund
Symbol: FMILX
NAV: $29.93
Objective & Strategy
- JMCVX: Janus Investments invests in this fund in order to pursue capital appreciation. This is achieved by investing in mid-sized companies that are currently trading at a discount. The value of the acquisition itself is valued as being within the range of the Russel Midcap Value index. This is a value-based fund.
- FMILX Fidelity pursues capital appreciation by identifying future beneficiaries of social and economic change. This is achieved by examining social attitudes, legislative actions, economic plans, product innovations, demographic shifts, and other trends to identify what is shaping the market place.
Comparative Performance
Average Annual Returns: JMCVX
1yr: -3.81%
3yr: 4.91%
5yr: 2.2%
10yr: 7.62%
Average Annual Returns: FMILX
1yr: 4.57%
3yr: 7.18%
5yr: 3.48%
10yr: 5.45%
Distributions
Fund: JMCVX
2007: $3.12
2008: $0.98
2009: $0.1
2010: $0.16
Fund: FMILX
2007: $4.39
2008: $0.19
2009: $0.11
2010: $0.16
Capital Requirements & Fees
Fund: JMCVX
MER: 0.99%
Front End Load: 0
Back End Load: 0
Min Investment: $2,500
Fund: FMILX
MER: 1.04%
Front End Load: 0
Back End Load: 0
Min Investment: $2,500
Risk Metrics
Fund: JMCVX
SD (fund): 17.42
SD (cat): 18.64
Beta: 0.9
Alpha: 0.15
R-SQ: 95
Best 3mo: 26.01%
Worst 3mo: -28.63%
Fund: FMILX
SD (fund): 20.23
SD (cat): 18.64
Beta: 1.04
Alpha: 0.43
R-SQ: 93
Best 3mo: 33%
Worst 3mo: -33.24%
Holdings
Fund: JMCVX
Asset Classes: 90%+ Equities
Industries: 20% Financials, 12% industrials, 11% Oil/Gas, 11% Consumer Services
Company Weightings: Equal Weightings to companies, and heavy exposure to financials industry
# Holdings: 165
% of top 10: 12.25%

Fund: FMILX
Asset Classes: 90%+ Equities
Industries: 20% Technology, 14% Health Care, 13% Consumer Goods, 11% Financials
Company Weightings: Heavily weighted to top ten holdings and technology industry.
# Holdings: 206
% of top 10: 19%


